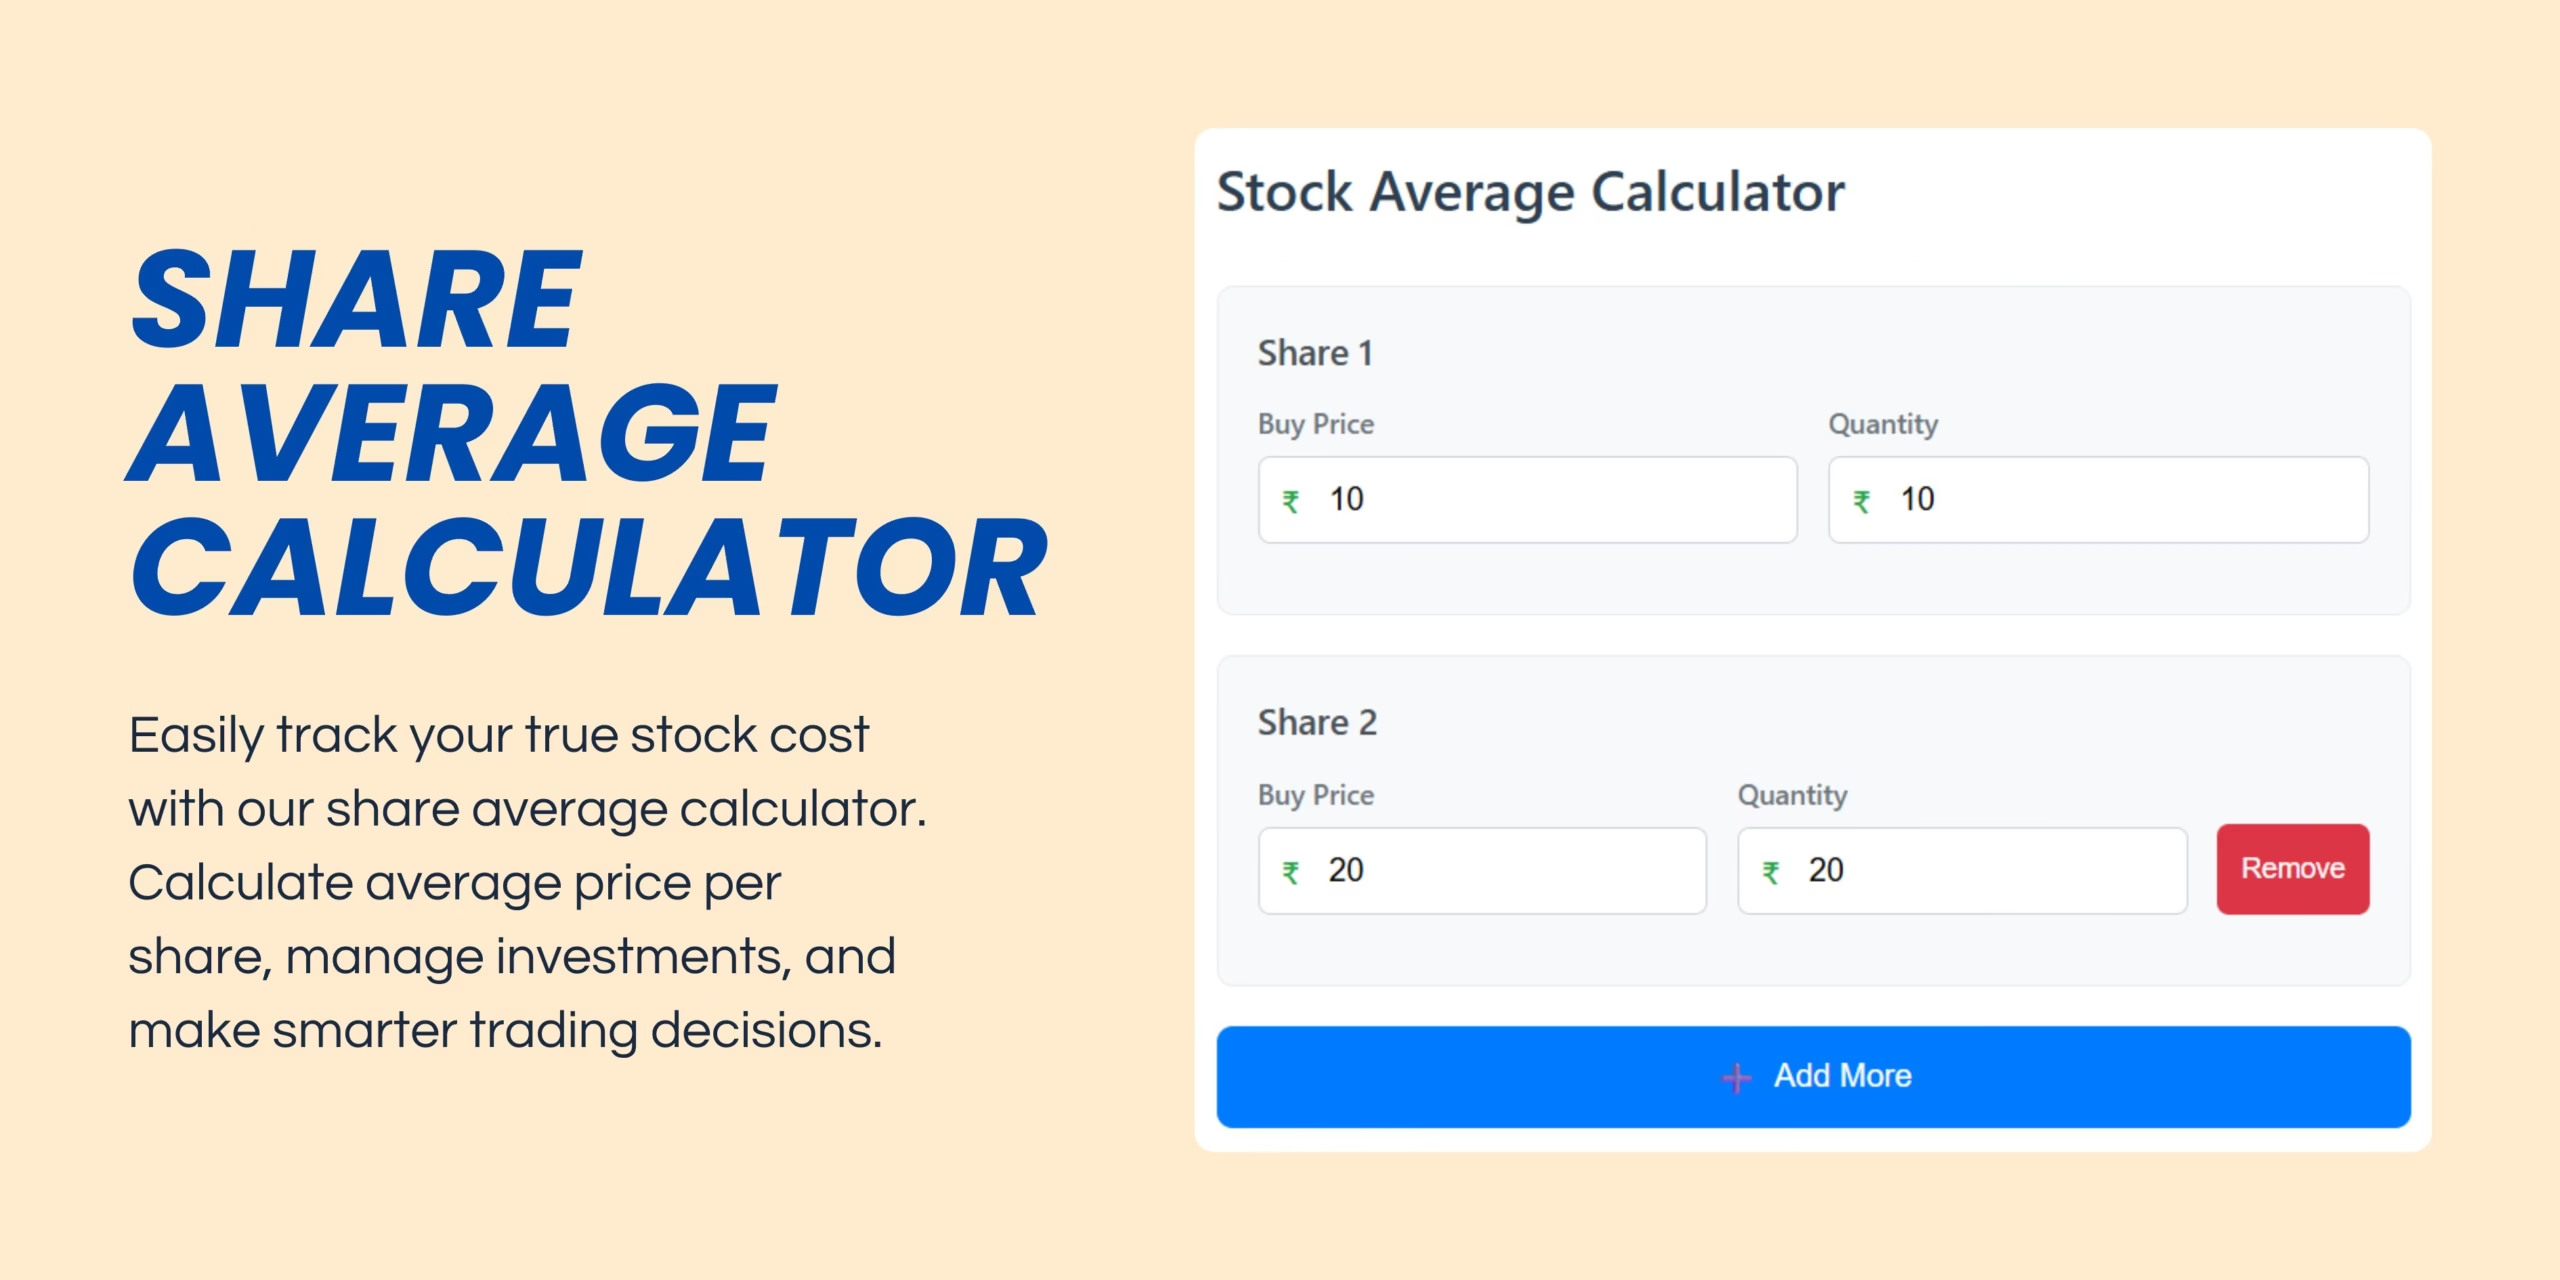
Share Average Calculator
Investing in the stock market is exciting, but it can also be confusing when you buy the same stock at different prices over time.
Have you ever wondered, “What’s my actual average price?” That’s where a share average calculator comes to the rescue.
This simple yet powerful tool helps you calculate the average cost per share when you make multiple purchases of the same stock at different prices.
By knowing this number, you can track your true investment cost, measure profits accurately, and make smarter buy-or-sell decisions.
In this article, we’ll explore why a share average calculator is essential, how it works, examples to make it clear, tips to use it effectively, and its limitations.
Table of Contents
Why Do You Need a Share Average Calculator?
When you invest in a stock, you rarely buy it all at once. Instead, most investors:
- Buy in multiple lots at different times.
- Average down when prices fall.
- Add more when confident about a company’s growth.
Without a share average calculator, you might end up guessing your average price, which can mislead you.
For example:
- You buy 50 shares of Company A at ₹100 each.
- Later, you buy another 50 shares at ₹120 each.
What’s your average price? Some investors wrongly assume it’s ₹110. But if you add brokerage, different quantities, or multiple transactions, manual calculation becomes tricky.
That’s why a share average calculator saves time and eliminates errors.
Take a look at our SIP Calculator
How Does a Share Average Calculator Work?
At its core, the calculator uses a simple formula:
Average Price = (Total Investment ÷ Total Shares Bought)
Or more precisely:

Example 1: Simple Two Purchases
- First Purchase: 15 shares @ ₹10 = ₹150
- Second Purchase: 20 shares @ ₹12 = ₹240
- Total Investment = ₹390
- Total Quantity = 35 shares
- Average Price = ₹390 ÷ 35 = ₹11.14
Your share average calculator instantly gives you this result.
Example 2: Adding More Lots
- 100 shares @ ₹200 → ₹20,000
- 50 shares @ ₹180 → ₹9,000
- 150 shares @ ₹210 → ₹31,500
- Total Investment = ₹60,500
- Total Quantity = 300 shares
- Average Price = ₹201.67
Imagine doing this math manually every time you buy — the calculator makes it effortless.
Why Knowing Your Average Price Matters
Using a share average calculator is not just about convenience. It has real benefits for every investor:
- Accurate Profit Tracking – Know exactly how much you’ve gained or lost.
- Better Decisions – Avoid emotional decisions by relying on numbers.
- Smart Averaging Down – See if buying more at a lower price really reduces your cost effectively.
- Negotiation & Taxation – Helps in reporting cost basis for capital gains tax.
- Confidence in Trading – A clear picture reduces confusion and doubt.
Where Can You Use a Share Average Calculator?
- Long-Term Investors – When building a stock portfolio with SIPs or staggered purchases.
- Traders – To track cost after averaging up or down.
- Mutual Fund / ETF Investors – To check average NAV after multiple investments.
- Crypto Investors – Even in cryptocurrency, averaging across multiple purchases applies.
Tips to Use the Calculator Effectively
- Always enter correct quantities and prices – small errors can change results.
- Include brokerage or charges – add fees to investment amount for more accuracy.
- Use the same currency/unit – monthly vs. yearly or USD vs. INR mixing causes mistakes.
- Check average after every purchase – so you always know your real cost basis.
- Compare with market price – see instant unrealized profit or loss.
Limitations to Keep in Mind
While a share average calculator is powerful, it has some limitations:
- Doesn’t include tax calculations directly.
- Doesn’t automatically adjust for stock splits or bonuses (you have to input adjusted quantities).
- Doesn’t show realized profit unless sell transactions are added.
- Works only with numbers you enter — garbage in, garbage out.
Real-Life Anecdote: Averaging Gone Wrong
One investor bought a stock at ₹500 and proudly averaged down by buying more at ₹400. His average came to ₹450. But when the stock kept falling to ₹300, he realized averaging down without strategy can lock money for years.
The lesson? A share average calculator shows you the math, but the decision is still yours. Always combine calculation with proper research and risk management.
Quick Reference Table
Here’s a simple table showing how the average price changes with new purchases:
| Purchase | Quantity | Price | Investment | New Average Price |
|---|---|---|---|---|
| 1st Buy | 50 | ₹100 | ₹5,000 | ₹100.00 |
| 2nd Buy | 50 | ₹120 | ₹6,000 | ₹110.00 |
| 3rd Buy | 100 | ₹90 | ₹9,000 | ₹100.00 |
This shows how adding a new purchase at a lower price can reduce your overall average.
Final Thoughts
A share average calculator is more than just a number-crunching tool — it’s a confidence booster for investors. Whether you’re averaging down, tracking your cost basis, or planning your next move, knowing your true average price per share gives you the clarity you need.
In the fast-moving world of stock markets, emotions can cloud judgment. But numbers don’t lie. By using a share average calculator, you can stay objective, plan smarter, and grow your wealth with a clear strategy.
So next time you buy shares in multiple lots, don’t guess — calculate!
Frequently Asked Questions (FAQ)
1. What is a share average calculator?
A share average calculator is a tool that helps you find the average cost per share when you buy the same stock at different prices.
2. How does a share average calculator work?
It adds up the total money invested and divides it by the total number of shares purchased, giving you the true average price per share.
3. Why should I use a share average calculator?
It makes tracking investments easier, shows your real cost per share, and helps you make better buy or sell decisions.
4. Does the share average calculator include brokerage or taxes?
Basic calculators usually don’t. If you want a precise average, you can manually include brokerage or extra costs in your investment amount.
Disclaimer: The share average calculator explained in this article is for informational purposes only. It helps you quickly find the average cost per share based on the values you enter. It does not automatically consider brokerage fees, taxes, or stock splits unless you adjust the numbers yourself. Always treat this tool as guidance, not financial advice, and consult a qualified advisor before making investment or trading decisions.